The Explosive Play DNA Report

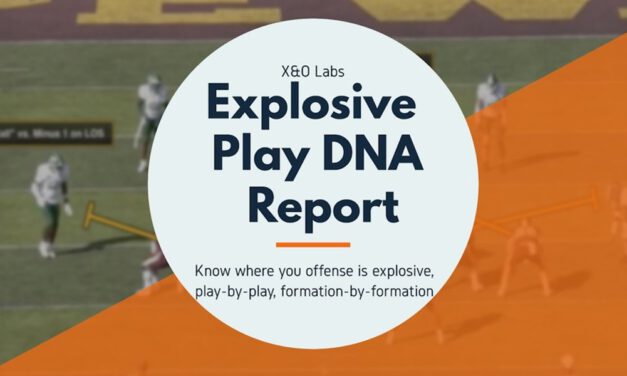
Every offense has explosive play potential — this report shows you exactly which plays in your playbook hit BIG, and which ones never do.

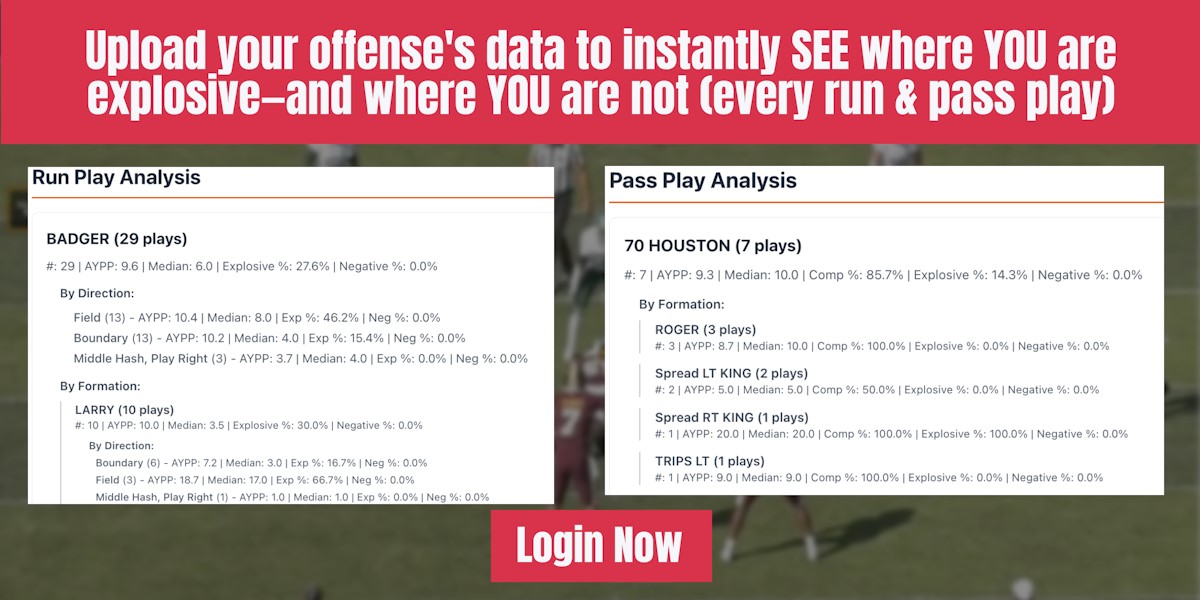
This report gives you a complete explosive-play breakdown of your offense using your own offensive data (downloaded from Hudl). Just upload your offensive data into the report generator and every run and pass play is analyzed to show not just production — but where, how, and why explosives are happening (or not happening).


What the Explosive Play DNA Report provides YOU:

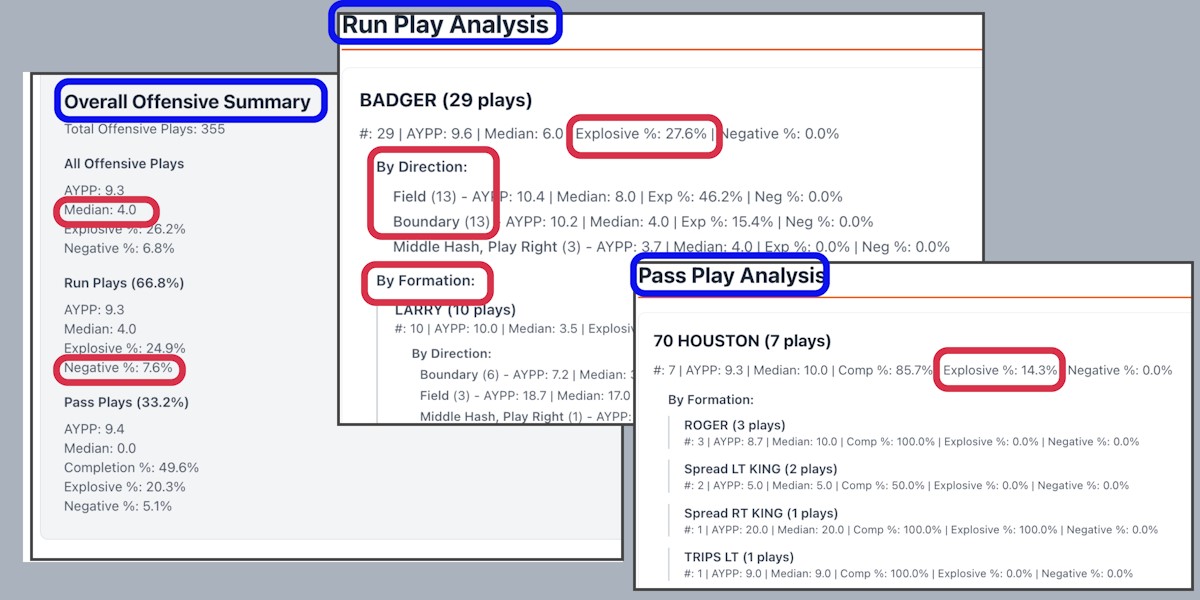
  • A full explosive profile of every run and pass concept in your offense
  • Average yards, median yards, explosive rate, and negative play rate for every play
  • Run-game breakdowns by concept, formation, and direction (field and boundary)
  • Pass game breakdowns by concept and formation, including completion and explosive rates
  • Clear identification of where concepts are situationally explosive and where they stall
  • Side-by-side comparison of plays that feel explosive versus those that actually are
  • Visibility into how your run and pass explosives interact across your entire offense
  • Immediate insight into which calls deserve more volume and which need to be rethought


This self-scout report connects your run and pass game together in one offensive snapshot. You can see how explosives are distributed across your entire offense, where volume should increase, where it should decrease, and where adjustments — not wholesale changes — can dramatically improve production.

Ready to get started? It’s easy to use (login below and scroll down to see the Explosive Play DNA Report generator).

Just upload your offensive data (downloaded from Hudl). One second later — you get a clear, detailed report that reveals the true DNA of your offense’s explosive potential — play by play, formation by formation.

Login below, upload your file, and download your report. Know more. Score more.


Read More

The Wide Zone Explosive Study

By Mike Kuchar
Co-Founder/Senior Researcher
X&O Labs
@MikekKuchar


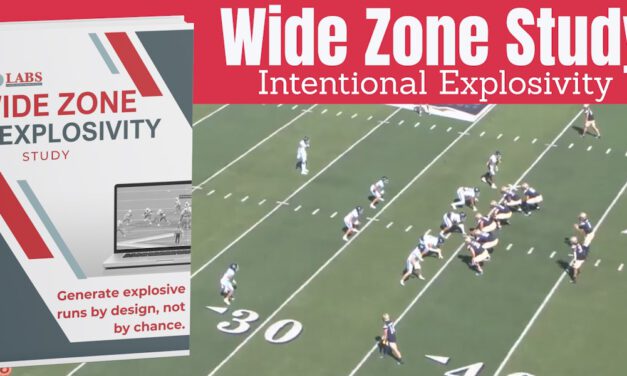
EDITOR’S NOTE: Explosive wide zone runs are intentional — this study shows exactly which formations, paired with specific fronts and coverages, force explosives, and includes our new Explosive Play DNA Report analysis tool that reveals where YOUR offense is explosive — and where it is not.


I have a confession to make…

I have a love/hate relationship with wide zone. I get enamored when I watch programs like Notre Dame, UCONN, Cincinnati, and South Dakota run the scheme to perfection. The synchronized footwork of offensive linemen resembles a Shen Yun performance as the ball carrier weaves and punctures through creases in the defensive front. Ok, I got carried away there. But, man, I gotta tell you, as Brian Ferentz at Iowa once told me years ago. “It’s a thing of beauty when it works out.”

But my frustration escalated when I started to realize how expensive wide zone is to teach. Thinking about teaching horizontal- and not vertical- double teams, how to get the back to perfectly read the end man on the line of scrimmage, and how to build in all the backside controls to prevent those nasty defensive ends from running things down on the backside just got me exhausted. All of those home run, explosive runs on the tape looked awesome, but I was having a hard time just being efficient with the concept. So, I became non-committal.

I completely gave up on installing it and committed to Pin and Pull runs instead. Yes, this was partly because I didn’t have a Center who could handle the play side A gap, but mainly because I didn’t think that I could do the scheme justice by teaching it the right way. So, I left my fascination with wide zone… until now.

What if I told you that you can intentionally generate explosives from your wide zone runs by designing them from specific formations and generate maximum results against specific fronts and coverage? Now, maybe you don’t have to swim in the wide zone ocean; you can simply dip your toe in the pull and still dunk the defenses you face.

That became the impetus of this study. X&O Labs went all in on studying how wide zone runs can produce explosive runs, which are runs of ten yards or more. Our starting point was using last season’s data. We studied 1507 runs in the wide zone family from the top 20 programs at the FCS and FBS levels that were most efficient in the wide zone. These included UCONN, Cincinnati, Iowa, South Dakota, Notre Dame, and Lehigh, to name a few. And here’s what we found: 537 of those runs generated explosivity, and that wide zone generated a 19.4% total explosivity rate, which is 34.7% more than the next concept (Counter).

We’re going to teach you exactly how to do that yourself by designing your formation structures to manipulate numbers in the box and your Jimmy on their Joe in the open field. That, my friends, equals explosivity. And I’m even going to tell you how you should not run wide zone…


Here’s Exactly What You’re Going to Discover in This Study:

  • Why some wide zone runs are structurally built to be explosive—and others never will be, no matter how well they’re blocked
  • The hidden relationship between formation, front, and coverage that quietly determines explosive potential before the ball is snapped
  • Which wide zone structures create explosive runs with the fewest teaching costs
  • Where the ball actually wants to hit on explosive wide zone plays — and why most backs are taught to look in the wrong place
  • How certain personnel groupings manufacture numbers advantages that defenses struggle to correct in real time
  • Why the boundary has become one of the most misunderstood sources of explosivity in wide zone football
  • How motion can either unlock front-side explosives — or completely kill them—depending on how it’s paired
  • The specific formation families that consistently produce explosives — and the ones that quietly drag your explosive rate down
  • The most common wide zone looks that feel right on the call sheet but show up as low-return plays in the data
  • The two wide zone decisions that cost offenses explosives more than any others
  • And finally, how to turn the research back on yourself by uploading your own offensive data (from Hudl) to instantly see:
    • Where your explosive runs (and passes) actually come from
    • Which formations and directions (field or boundary) quietly produce explosives — and which don’t
    • How your explosive runs and explosive passes interact across your offense
    • Which calls deserve more volume — and which ones need to be questioned


This study doesn’t just show you how wide zone explosives are created by others. It shows exactly where you’re creating explosives in your own playbook — by both run and pass plays, formation, and play direction (field and boundary). Let’s get started…


Read More

The QB G Lead: The Answer to Odd Quarters Defense

By Mike Kuchar with Hayden Mace
Offensive Line Coach
Central Michigan University
@CoachHaydenMace


“I would build my offense around the QB G Lead. It’s been our best quarterback run scheme for the last three years.”
– Hayden Mace, offensive line coach/run game coordinator, Central Michigan University


When Matt Drinkall took the post at Central Michigan, it was a foregone conclusion that he would build his offense around gap schemes. It’s what he’s done his entire career at with a great deal of success. And when he poached Jim Chapin and Hayden Mace from Eastern Washington, the trio found a way to blend Drinkall’s gap schemes with EWU’s QB run game. The concoction became the QB G Lead play, the Chippewas’ most efficient QB run this season. Chapin and Mace brought the scheme over from Eastern Washington and fine-tuned it for QB Angel Flores, who produced over 64 yards on the ground for Central Michigan this season before getting hurt.

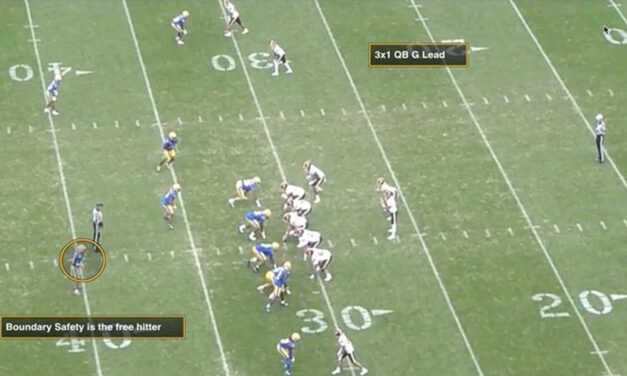
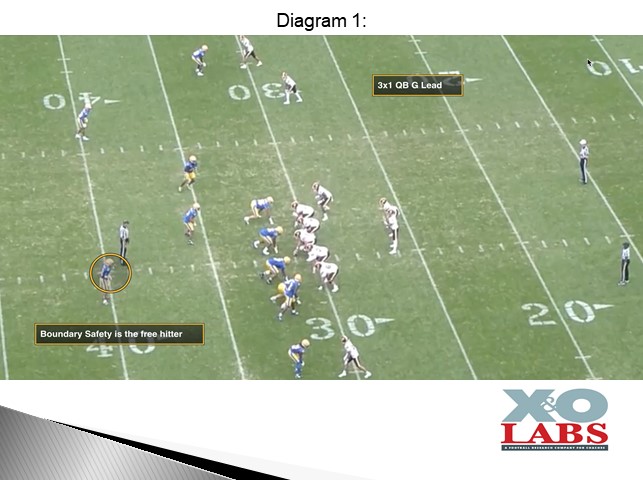
While it was a solid concept for any front, it became a routine check against Odd Quarters looks and against defenses like Michigan and Eastern Michigan, who would continually crush the front and try to push the ball to the perimeter. It allowed the offensive line to wall everything off and gain a blocker for the force defender. With the QB run element, you had a hat for every defender. It was particularly inviting against quarters defenses from 3×1, where the free hitter becomes the boundary safety.


In this exclusive report, we’re going to reveal the rules of the play, how it gets adjusted with a grounded tight end, and what Coach Mace did to prepare against movement fronts that would try to spill the play.

Read More

3rd Down Conversion Self-Scout Report Generator

“Keep the chains moving and you’ll eventually find the endzone…”

A first-year OC at the FCS level shared this with me. At the time, he had never called a play in a game, but he said this with all the confidence of an ‘old-timer’. And judging by his success on 3rd downs, I’d say his confidence was warranted.

I think much of his success came from knowing more about his own 3rd down offense than opposing DCs knew about it. As we like to say, “Know more. Score more.”

Our brand-new 3rd Down Conversion Report generator is based on much of the same self-scout analysis our young OC uses each week. I know because we built many of his scouting tools.

Just upload your offense’s data from Hudl and you’ll instantly get a detailed report on your 3rd down conversions:

  • Your overall 3rd down conversion rate
  • The conversion rate for every distance (3rd & short, 3rd & medium, 3rd & long, and 3rd & extra long). Plus, the conversion rate for run plays compared to pass plays in these same distance categories.
  • The conversion rate for EVERY play ran in 3rd & short, 3rd & medium, 3rd & long, and 3rd & extra long.
  • Plus, you’ll also see the average yards per play, median yards, explosive percentage and completions (pass plays) for every 3rd down play


Watch the video and then login below. Once you do, this page will expand you’ll see the 2nd Down Efficiency Report generator below.

Just Upload Your Offense’s Data from Hudl and Your 3rd Down Conversion Report is Done.


Let’s get started: Login and you’ll see the 3rd Down Conversion Report  generator below. Just upload your offensive data (CSV or Excel files) from Hudl. One second later you get a clear, detailed report on your 3rd down conversions — short, medium, long and extra long distances. And with this report, you’ll better prepare your offense and call plays with more confidence.


Read More

2nd Down Efficiency Self-Scout Report Generator

Half of all your play calls on 2nd down are efficient —- the other half are not.

The problem is you don’t know which half is which…

I’ve found that is a good ‘rule of thumb’ for most offensive play-callers. Half your plays will get you 50% of the yards needed to convert and the other half fall short. And when you know which plays are efficient and which aren’t, you’ll be a better play-caller.

To help you, we’ve just launched our brand-new 2nd Down Efficiency Report generator that does all the analysis for you — instantly. So now, you’ll know…

When you upload you offense’s data from Hudl, you’ll get a detailed self-scout report that will tell you…

  • Your overall 2nd down efficiency rating
  • Efficiency rating for EVERY play you’ve ran on 2nd down by formation
  • And you’ll also see the average yards per play, median yards, explosive percentage


Watch the video and then login below. Once you do, this page will expand you’ll see the 2nd Down Efficiency Report generator below.

Just Upload Your Offense’s Data from Hudl and Your 2nd Down Efficiency Report is Done.


Let’s get started: Login and you’ll see the 2nd Down Efficiency Report  generator below. Just upload your offensive data (CSV or Excel files) from Hudl. One second later, you get a clear, detailed report on your 2nd down efficiency — play by play, formation by formation. And with this report, you’ll better prepare your offense and call plays with more confidence.

Know more. Score more.


Read More

1st Down Efficiency Self-Scout Report Generator

How well do you know your offense’s true efficiency on 1st down?

Sure — you probably know the percentage of plays that gain 40% of the needed yards to gain a first down. You likely know the average yards gained by each play.

But those are just surface data, and they never tell the whole story.

When you upload your offense’s Hudl data into our 1st Down Efficiency Report Generator, you uncover the real identity of your offense on 1st down:

  • Volatile plays that risk losing yards (these plays often have good average yards)
  • Under-used plays you should call more often (those little-used plays you forget about)
  • Play and Formation combinations that produce the best outcome
  • Should you pass or run? This analysis will answer that question


And when you combine median data with average yards, you finally see which plays you can call with confidence…and which ones quietly hurt you.

That’s exactly what our new 1st Down Efficiency Report generator is built to reveal.

Just Upload Your Offense’s Data from Hudl and Your Self-Scout Report is Done. Watch This Video…


Ready to get started? It’s easy to use (login and you’ll see the 1st Down Efficiency Report  generator below). Just upload your offensive data (CSV or Excel files) from Hudl. One second later you get a clear, detailed report that reveals your true 1st-down efficiency—play by play, formation by formation. And with this report, you’ll better prepare your offense and call plays with more confidence.

Login below, upload your file, and download your report. Know more. Score more.


Read More

Oklahoma State’s Coverage Catalog from 7-Up Presentations

By Mike Kuchar with Joe Bob Clements
Former Linebackers Coach
Oklahoma State University
X&O Labs
@MikeKKuchar


“Cover Zero became the foundation for us. Then we kept the same presentation and gradually built off of it.”
– Joe Bob Clements, (former) linebackers coach, Oklahoma State University


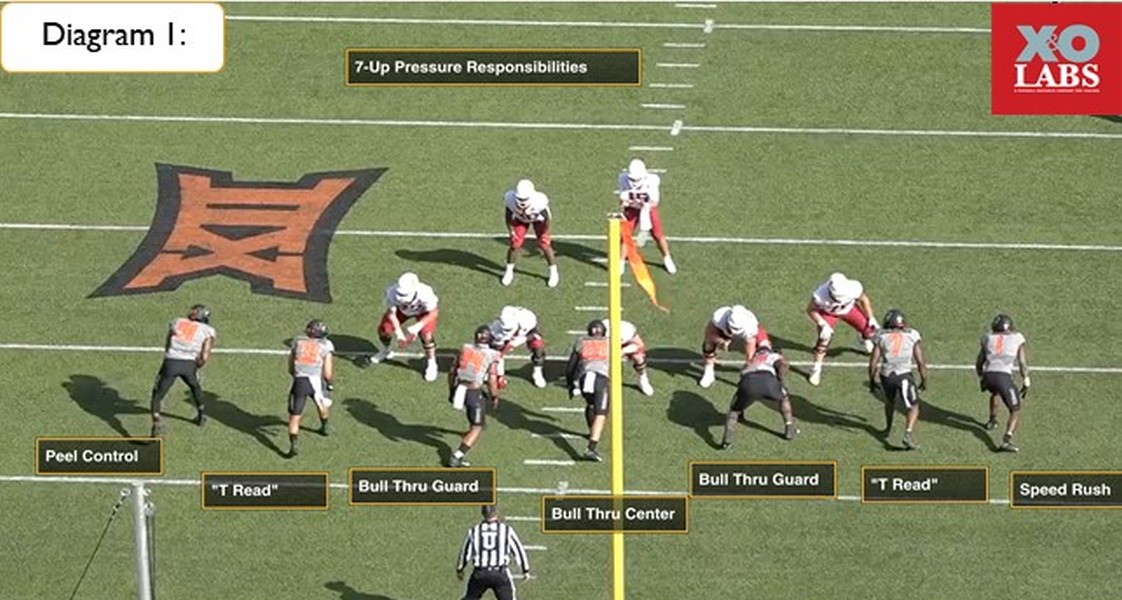
The base premise of “7-Up” presentations is to show pressure and dictate protections. What started at Oklahoma State (and other programs) as a cover zero tool gradually morphed into a complete coverage catalog of these pressure presentations. They were traditionally used on second and long and third and medium plus passing downs against 2×2 open and 3×1 open formations. The pressures don’t work as well against seven man protections because each defender can be accounted for.

At Oklahoma State, the “7-Up” pressure presentation catalog was tagged in the following ways:

“A’s/Conseco”- Cover Zero

“Purple”- Tampa

“Black”- Cover Two

“Magenta”- Bracket


Zero Coverage Variation:

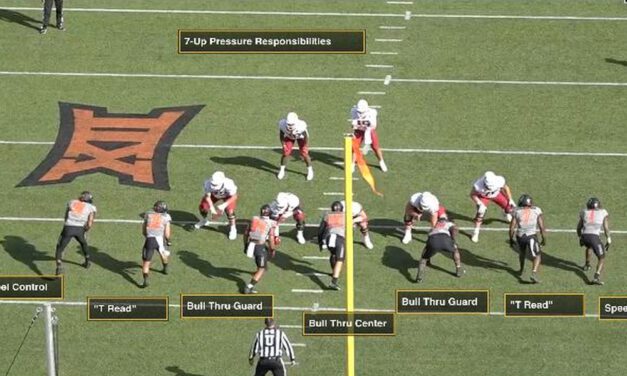
This is ground zero for this 7-Up pressure presentation package. The goal is to outnumber these six-man protection schemes with seven defenders at the line of scrimmage. There are no games or stunts in this presentation. Each first level defender has a gap to own, but, in order to make sure this scheme is coached well enough, you have to be able to teach defenders to handle any screens. Therefore, Coach Clements and the staff at Oklahoma staff devised a set group of rules that gave them their responsibility on any wide receiver tunnels or running back delay screens.

The rules are below:

  • Defenders on Guards: Full slide technique. If guards block them, they go into a bull rush with eyes on RB for slip screen.
  • Defender on Center: If Center looks at him and blocks him, he bull-rushes with eyes on the slip screen of RB.
  • Defenders on Tackles: T Read technique. Tackle goes out, they come underneath. Tackle goes down, they come off his ass.
  • Defenders Outside Tackles: Speed rush off edge with peel control on RB.


Read More

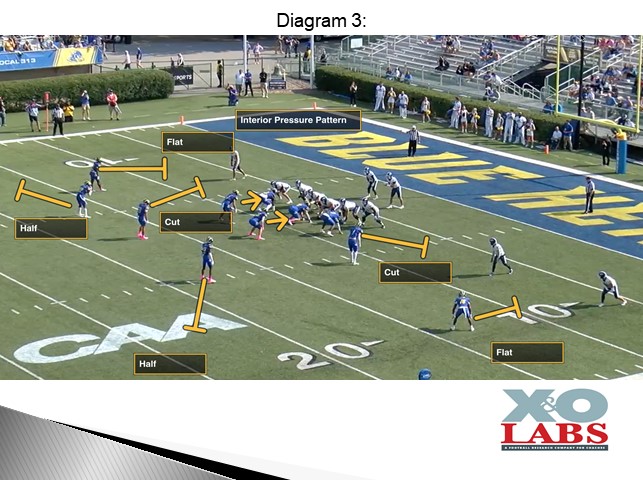
Two-Deep, Five Under Zone Pressures from 3-High Structure

By Mike Kuchar with Manny Rojas
Defensive Coordinator
University of Delaware
@Coach_Rojas_UD


Coach Rojas pressure package from his three-high safety look is quite extensive, as detailed previously when I worked with him. While in previous clinics, Coach Rojas detailed his man pressure and 3-deep, 3-under pressure concepts, this time around he was gracious enough to talk about his Two-Deep, Four Under zone pressures which he utilized a high percentage of times this season, typically in the red zone where his hard corners were able to set hard edges and get players on the ground. It was also a good answer against condensed splits where corners can be activated quickly.

It became an early down call for Coach Rojas where the edges were secured. “We got more athletic, so it gave us the ability to play some wall, match two technique,” he told me. The benefit of the three-high structure allowed for different inverted patterns by those safeties to either play deep half or his Wall (cut two) technique.

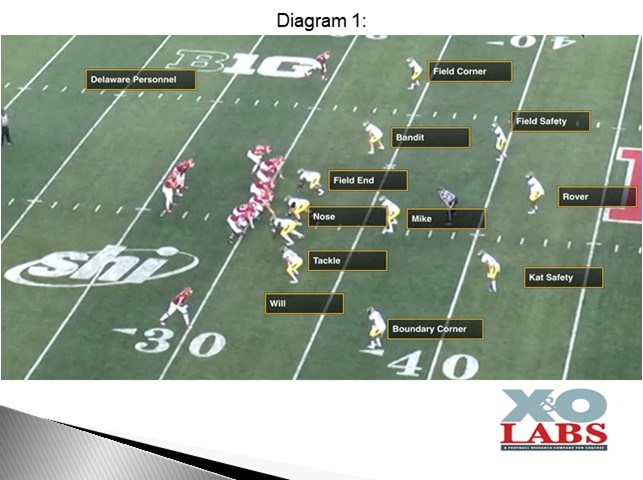
Coach Rojas base personnel operate like an Odd Stack consisting of the following:

  • Nose- No lag player, pure zero tech vertical player
  • End- mainly to the field or offensive strength
  • Tackle- mainly to the boundary
  • Mike- Middle linebacker
  • Will- Weak side linebacker
  • Bandit– Strong side linebacker
  • Rover– Middle safety (glorified linebacker in this system)
  • Field Safety– Best cover safety
  • Kat– Weak side safety
  • Field Corner– can play left and right based on tempo
  • Boundary Corner- can play left and right based on tempo


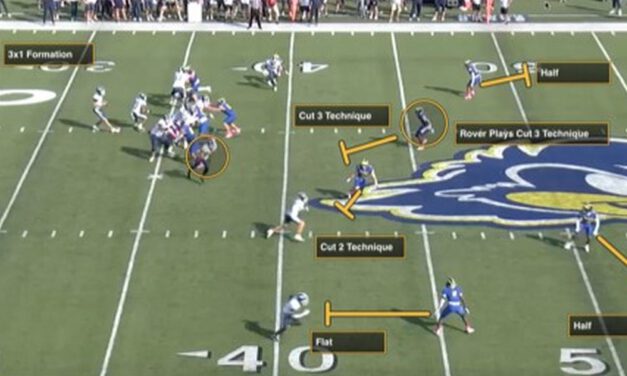
Coach Rojas can either insert the Rover inside out to play the cut two technique or walk down the safety, who can help both ways. It can change from game to game. The difference is that the Rover has to be athletic enough to play a half-field technique, which sometimes it’s very difficult to do.


Terming Pressure:

There may not be any rhyme or reason to how Coach Rojas terms his pressure package, but they are centered around the following patterns:


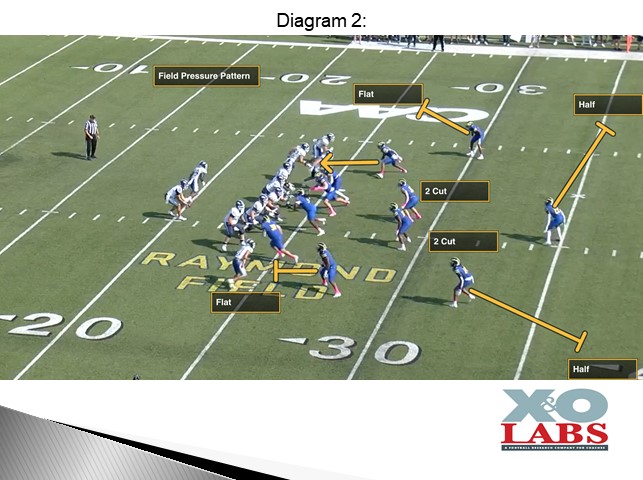
Field Pressure

Field Pressure activations typically include the Bandit and Mike as the fourth and fifth rusher. In most cases, the Rover inverts to play cut technique with the Will while the Kat and Field safety are the hash defenders.


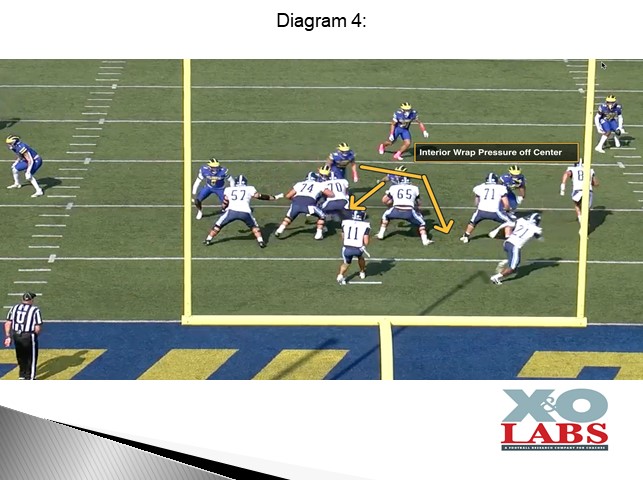
Middle Pressure

The middle pressure pattern includes both the Mike and Will who will face read the Center on their activations.


Coach Rojas will continually change up the pressure angles with these two defenders to the point where players actually will create their own adjustments during the course of the game based on the slide of the Center. The intention is to get a one-on-one with the back in these protections. In these activations, the Rover and Bandit are the two-cut defenders.


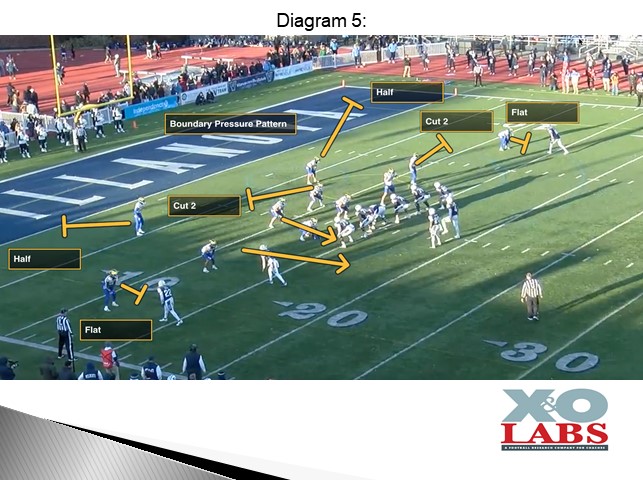
Boundary Pressure:

Boundary pressure patterns typically include the Will and the Kat safety on the pressure. The Bandit and Mike play the cut two technique, while the Rover and Free Safety are deep half defenders. Coach Rojas mentioned these are better calls in the red zone than in the open field.


How these pressures can be tagged and adjusted based on formation structures will be the purpose of this report.


Editor’s Note: In this report, Mike reveals the details of how this works, and best practices, and he identifies who else is using it. And, as always, Mike includes a lot of video and diagrams—as well as shares where to find more game film in X&O Labs’ Film Room. Login below to get unlock the full report (and if you’re not a member, click the ‘Join’ button in the upper right-hand corner of this page).


Read More

Who Are College Football’s (FBS) 10 Most Efficient Offensive Coordinators?

We Ranked 27 Power 4 Offensive Coordinators Using 8 Core Performance Metrics and Here’s What We Found


By Mike Kuchar
Co-Founder/Senior Research Manager
X&O Labs
@MikeKKuchar


Offensive coordinators build their brand on efficiency, not wins. It’s the “take what a defense gives you” mindset, where you “you don’t go broke taking a profit” is one of the more common mantras in offensive staff rooms. Because if you have the patience to do that enough times in the game, it will typically result in wins. In time, offensive efficiency is the constant that keeps coordinators in jobs and programs in the win column. So, at X&O Labs, we have created an analytical system that defines offensive efficiency in 8 core performance metrics and tracks and identifies the most efficient offensive coordinators at the FBS level.

We did our research by segmenting and filtering game data over the last three football seasons that are relevant to every eligible coordinator at the Power 4 level (we define our eligibility requirements below). We then input them into our analytical system to produce a composite ranking for each offensive coordinator. Because we had several coordinators coming from a variety of different programs and conferences, we had to level the competitive playing field.

To gauge an ideal sample size, coordinators had to have at least three consecutive years of play-calling experience. That was enough of a buffer to weather the opposing defensive coordinator’s learning curve. We also factored in games only against Power 4 (or Power 5 conferences from previous years), and ranked opponents were counted towards the coordinator’s data set. No “garbage time” or perceived cupcake opponents were accounted for.

In total, we analyzed play-callers that had a minimum sample size of 10 total games or at least 1,000 analyzed plays against Power 4 or ranked opponents over the last three consecutive seasons. This includes coordinators who came from lower-level tiers, like Mike Shannahan (James Madison), Marcus Arroyo (UNLV), and Will Stein (UTSA), who competed against Power 4 schools during their tenure.

SPOILER ALERT: Offensive mainstays like Kiffin, Sarkisian, and Heupel all made the list, but where they are listed may be a bit of a surprise. What’s even more telling is that three of the top 10 OC’s have less than five years of play-calling experience at the FBS level. So, yes, we are in the midst of a youth movement.


The Data Set Pre-Requisites:

To have these comparatives be as competitive as possible, we segmented our data into the following criteria:

  • Games that were conducted during the 2022, 2023 and 2024 seasons (3-season period), which includes regular season, playoffs, and bowl games.
  • Games that were registered against Power 4 (or Power 5 conferences from previous years) and ranked opponents were counted towards the coordinator’s data set. This includes coordinators that came from lower-level tiers like Mike Shannahan (James Madison), Marcus Arroyo (UNLV), and Will Stein (UTSA), who competed against Power 4 schools during their tenure.
  • Games that were registered against ranked opponents at the time of competition, even if they were not Power 4 or Power 5 conference opponents.
  • There was a minimum sample size of 10 total games or at least 1,000 analyzed plays.


The Eligible Candidates (in no particular order):

Having said all of that, we were left with the following coordinators to analyze:

Editor’s Note: There are a few head coaches on this list who have been credited for calling plays at some point during the last three seasons (Sarkisian, Kiffin, Malzahn, Brohm). These coaches were listed with the offensive coordinator by title.

  1. Aaron Roderick, BYU (1,760 plays analyzed)
  2. Andy Kotelnicki (Kansas: 1,251 plays analyzed, PSU: 870 plays analyzed)
  3. Barry Lunney, Illinois (2,238 plays analyzed)
  4. Ben Arbuckle (Western Kentucky: 174 plays analyzed, Washington State University: 1,007 plays analyzed)
  5. Jeff Brohm/Brian Brohm (University of Louisville: 1,565 plays analyzed, Purdue: 867 plays analyzed)
  6. Brian Lindgren (Michigan State: 639 plays analyzed, Oregon State: 1,194 plays analyzed)
  7. Casey Woods, SMU (1,249 plays analyzed)
  8. Chip Lindsey (UCF: 576 plays analyzed, UNC: 1,513 plays analyzed)
  9. Collin Klein (Kansas State: 1,532 plays analyzed, Texas A&M: 1,936 plays analyzed)
  10. Dana Holgersen (Houston: 721 plays analyzed, Nebraska: 783 plays analyzed)
  11. Des Kitchings, University of Virginia (1,999 plays analyzed)
  12. Garrett Riley (Clemson: 1,618 plays analyzed, TCU: 862 plays analyzed)
  13. Gus Malzahn, University of Central Florida (1,785 plays analyzed)
  14. Jeff Lebby (Miss State: 636 plays analyzed, Oklahoma: 1,669 plays analyzed)
  15. Josh Henson (Purdue: 588 plays analyzed, USC: 1,281 plays analyzed)
  16. Josh Heupel/Alex Golesh, Tennessee (2,082 plays analyzed)
  17. Kendal Briles (Arkansas: 837 plays analyzed, TCU: 1,643 plays analyzed)
  18. Kirby Moore, University of Missouri (2,118 plays analyzed)
  19. Kirk Ciarrocca (Minnesota: 722 plays analyzed, Rutgers: 1,488 plays analyzed)
  20. Steve Sarkisian, Texas (2,406 plays analyzed)
  21. Lane Kiffin/Charlie Weis Jr., University of Mississippi (2,377 plays analyzed)
  22. Marcus Arroyo (Arizona State: 795 plays analyzed, UNLV: 331 plays analyzed
  23. Mike Denbrock (Notre Dame: 860 plays analyzed, LSU: 1,479 plays analyzed)
  24. Mike Shanahan (Indiana: 605 plays analyzed, James Madison: 125 plays analyzed)
  25. Shannon Dawson (Houston: 144 plays analyzed, Miami: 1,456 plays analyzed)
  26. Tim Beck (New Mexico State: 251 plays analyzed, Vanderbilt: 882 plays analyzed)
  27. Will Stein (Oregon: 1,565 plays analyzed, UTSA: 169 plays analyzed)


The 8 Core Performance Metrics:

We created a formula based on eight core performance metrics to rank the play-callers. This process came from interviewing dozens at all levels of football to research what metrics are most representative of an offensive play caller’s efficiency.

The eight metrics are detailed below (in order of importance):

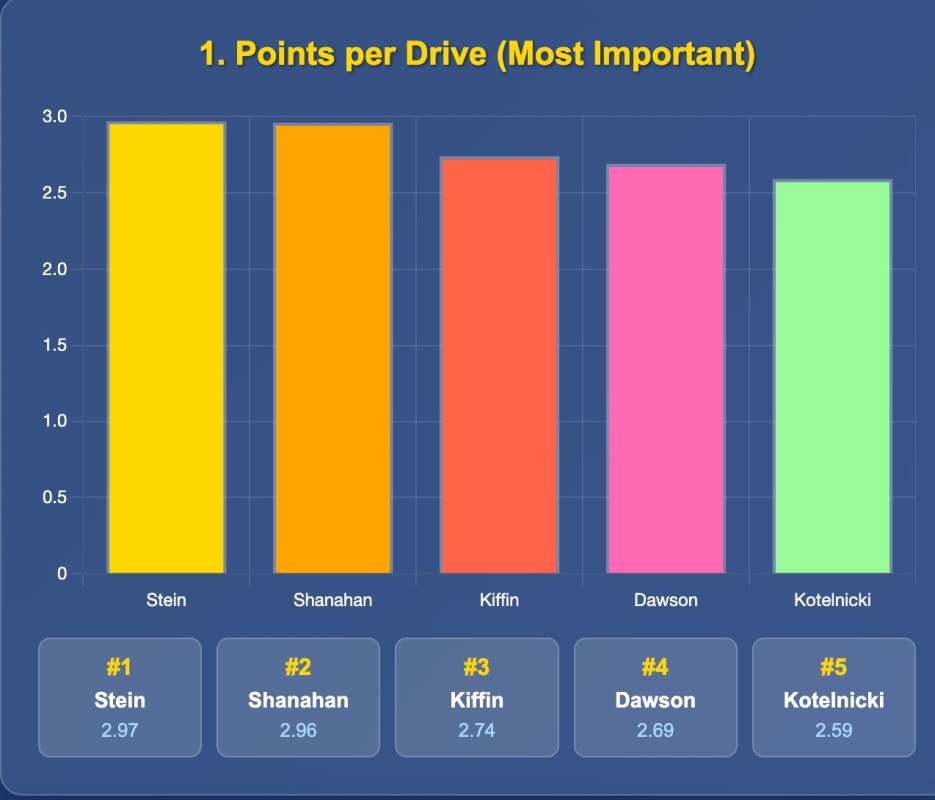
  1. Points per drive– a numerical average of how many points this offense produces per offensive drive.
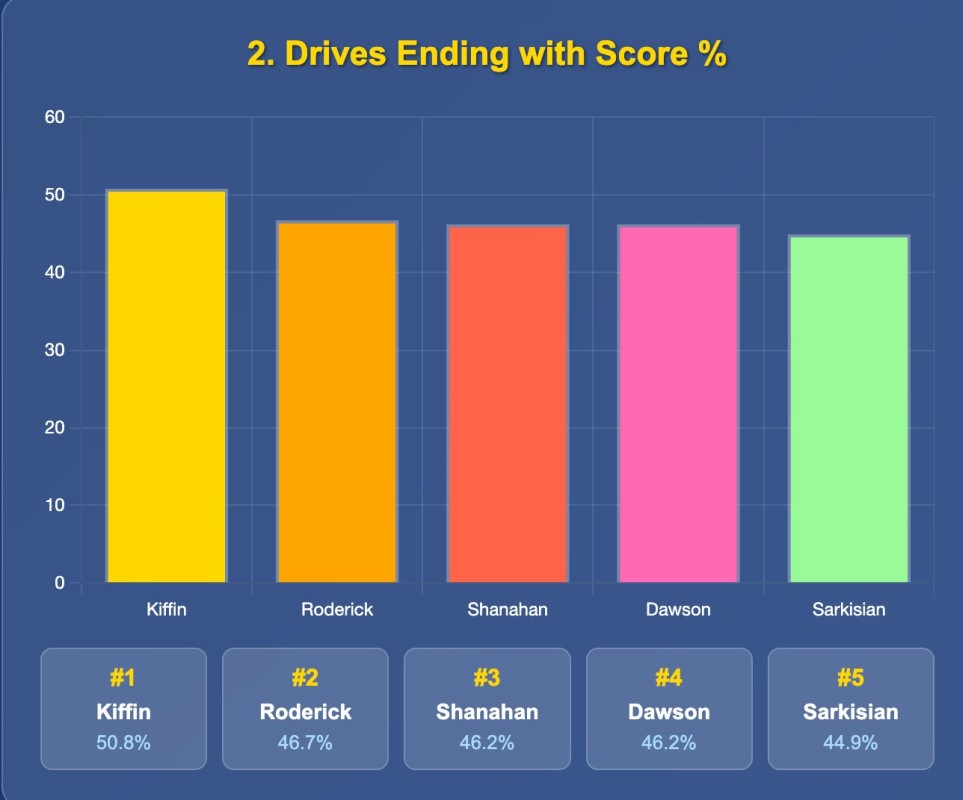
  2. Drives ending with a score percentage– the percentage of offensive drives that end with points, either a touchdown or a field goal.
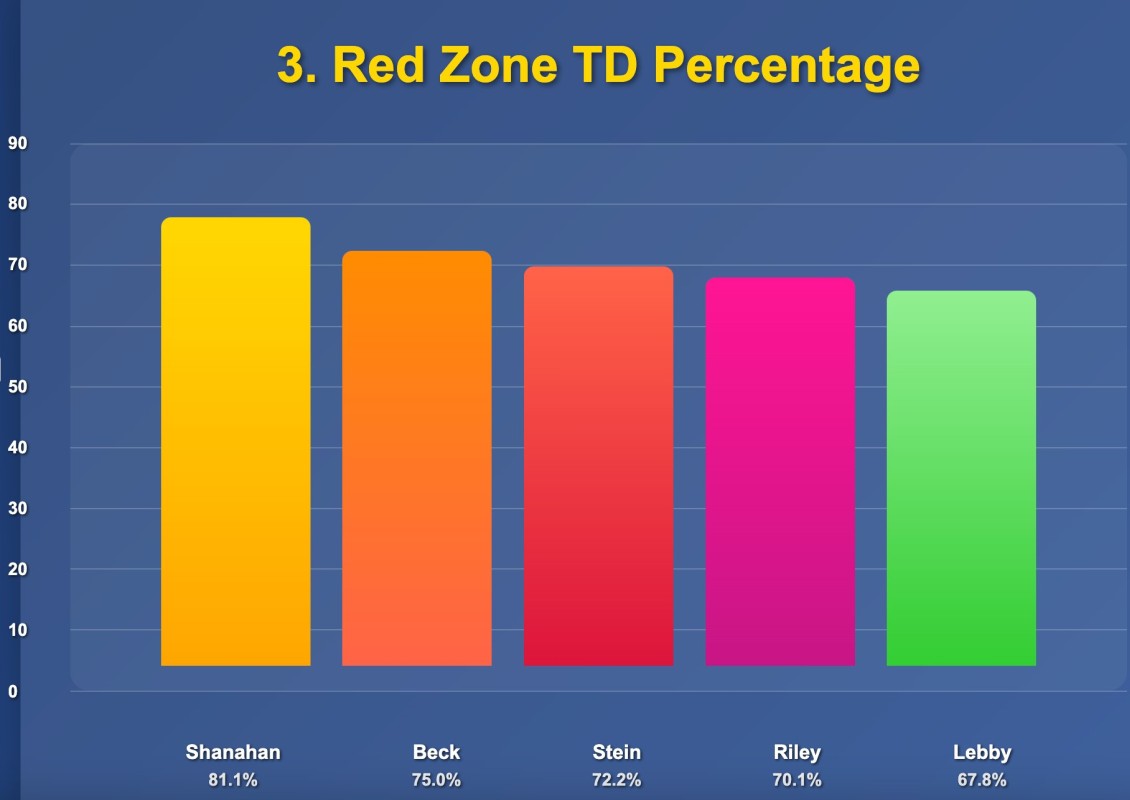
  3. Red Zone TD Percentage– the percentage of times this offense produces a touchdown (not a high-percentage field goal) inside the 20 yard line.
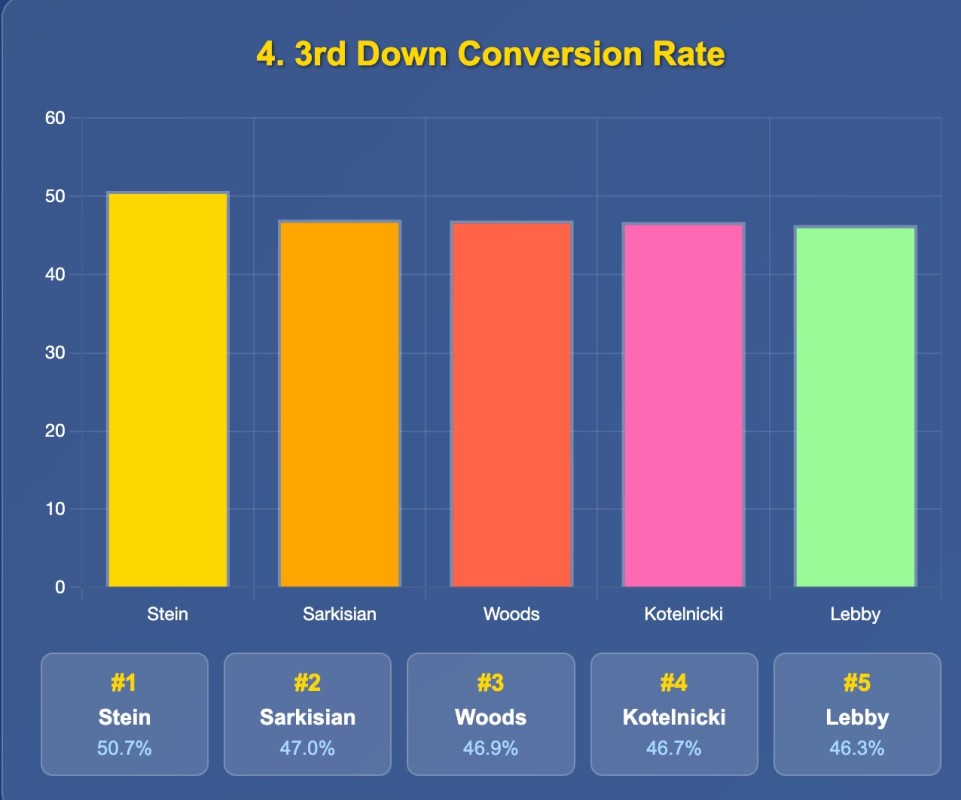
  4. 3rd down conversion rate– the percentage of times this offense converts a first down when there is no subsequent fourth down play registered.
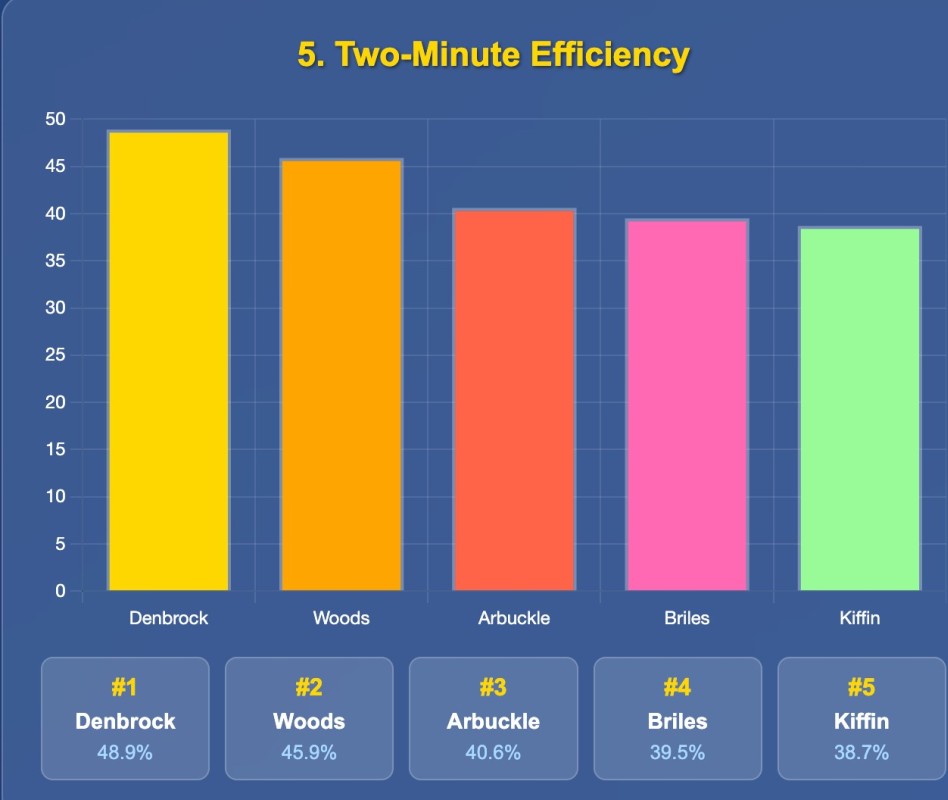
  5. Two-minute efficiency– the percentage of times this offense produces points (a touchdown or a field goal) in the last two minutes of a half and the last two minutes of a game.
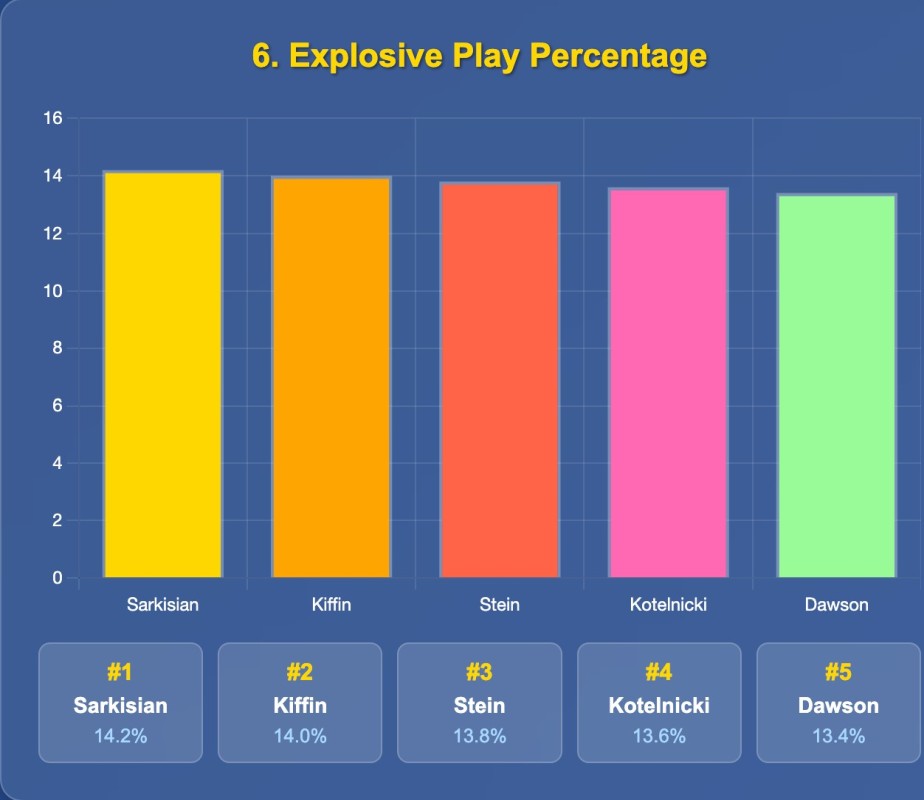
  6. Explosive play percentage– the percentage of times this offense generates an offensive play of 15 yards or more.
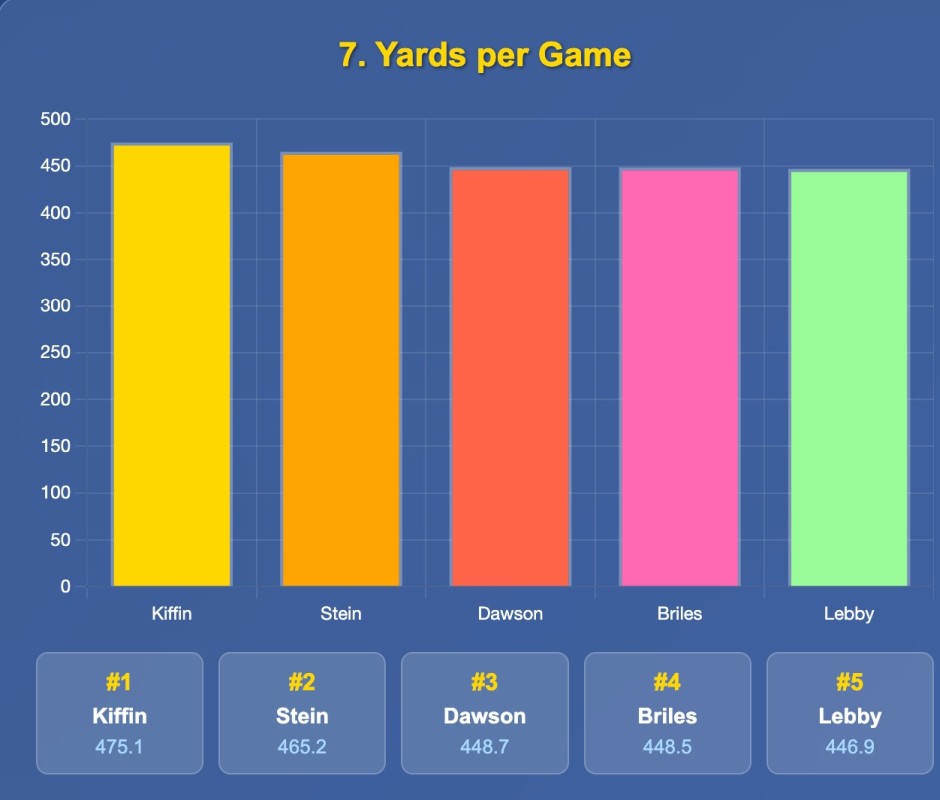
  7. Yards per game– the numerical average of how many yards this offense produces per game.
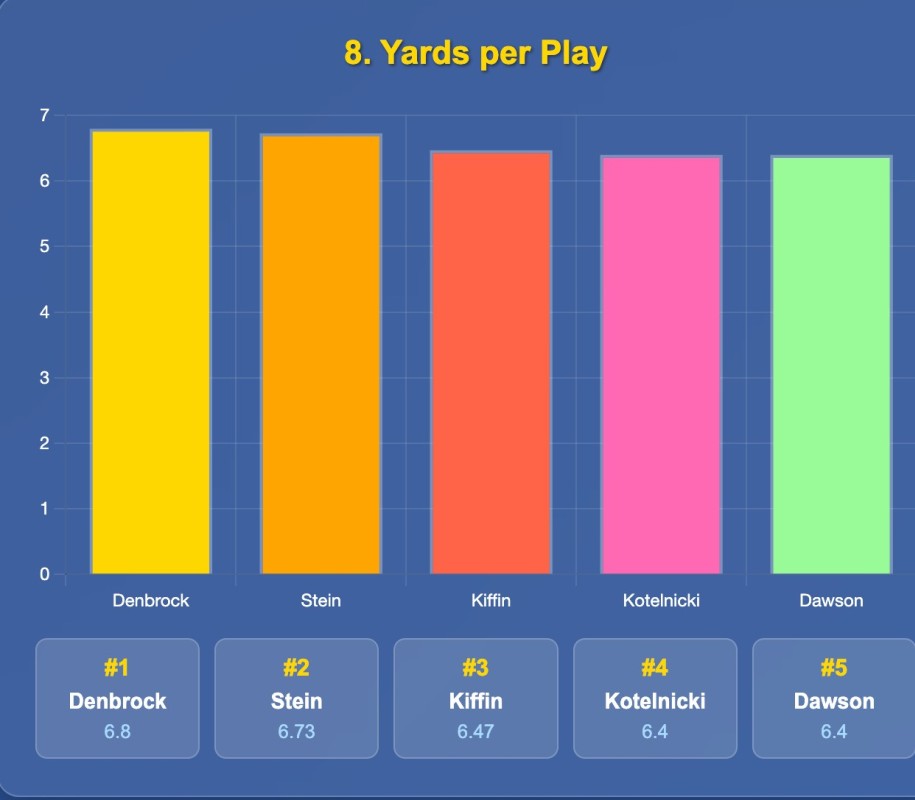
  8. Yards per play– the numerical average of how many yards this offense produces per play.


What Metrics Were Not Valued and Why:

  • Wins – We know that this is the only stat that counts as it relates to a team’s productivity, but there are far too many variables (defense, turnovers, special teams, head coach’s clock management, etc.) that affect games which we cannot let interfere with the offensive coordinator’s efficiency numbers.
  • Scoring Offense – This metric almost made the cut, but if we used it, we’d have to consider any “garbage time” numbers where an offense scored late in the game when it was not in doubt. Quite simply, we felt that the two-minute metric was more indicative of the efficiency of the play caller simply because he scored when he needed to, not because maybe he wanted to.
  • First Downs Generated – We realize this quantification is good for the stat books, but it doesn’t validate the ability of an offensive coordinator to finish in the end zone.
  • Turnovers – While some can pin things like interceptions on coaching (or lack thereof) this mainly falls as a human error statistic based on the player’s performance.
  • Time of Possession – This may have been a relevant metric a decade ago, but we cannot, in good faith, use this as a measure of efficiency. Many of the coordinators in this data set work in quick-tempo, no-huddle operations.


Why This Approach Works:

  1. It Prevents Single-Metric Dominance: No coordinator can rank highly based on just one strong metric
  2. It Emphasizes Efficiency Over Volume: Points per drive and scoring percentage get the highest weights.
  3. It accounts for Situational Success: Red zone and two-minute performance are crucial for the coordinator’s evaluation.
  4. It Balanced Assessment: All metrics contribute, but scoring efficiency is prioritized.


The Commonalities of Elite Coordinators:

These coordinators seemed to fall within the composite scoring range of 70-89 and possessed the following characteristics. Keep in mind, these numbers were all generated against similar competition.

  • Points Per Drive Excellence – The average in this group was 2.58, which surpassed the national average of 2.0. All but one of these coordinators exceeded 2.40.
  • Scoring Drive Efficiency – The average for this group was a 43.1% scoring rate. The national average is 37.8%.
  • Red Zone Mastery – The average for this group was 64.7% and seven of them achieved a 60% touchdown rate in the red zone. That is 20% higher than the national average among all coaches in this category.
  • Situational Excellence – This group averaged a 44.4% conversion rate on third down, whereas the national average was 41%.
  • Explosive Play Generation – This group generated an explosive play (15 yards or more) on 12.8% of snaps.
  • High Volume Production – This group averaged 438 yards per game against similar competition. The national average last season was 386.


Best in Class (Based on each Category):

While the composite score generated is representative of each of the following 8 performance metrics, these were the best coordinators in each category over the last three seasons:


Metric 1: Points Per Drive:
 

Metric 2: Drives Ending with a Score Percentage:
 

Metric 3: Red Zone Scoring Percentage
 

Metric 4: Third Down Conversion Rate:
 

Metric 5: Two-Minute Scoring Efficiency:
 

Metric 6: Explosive Play Percentage:
 

Metric 7: Yards Per Game:
 

Metric 8: Yards Per Play:
 

Most Top 5 Appearances:

Before we reveal the total composite scoring and ranking, we wanted to present the median number of appearances that each coach had in the Top 5 of each category.


Will Stein (Oregon)- Top 5 in 6 Categories

Lane Kiffin (Ole Miss)- Top 5 in 6 Categories

Shannon Dawson (Miami)- Top 5 in 5 Categories

Andy Kotelnicki (Penn State)- Top 5 in 4 Categories


The Top 10 Composite Scoring: Ranking the Most Efficient Offensive Coordinators in FBS Football

These metrics were then combined to produce a composite score from 0-100, with each category weighted in order of importance from 1-8. This generated a top 10 list of college football’s most efficient offensive coordinators:

To see the full list, including each coordinator’s composite score, ranking, and why they made the cut, please log in or click the ‘JOIN’ button now to start your membership with X&O Labs.

Based on our composite scoring model, which emphasizes scoring efficiency, situational performance, and explosive output, the results produced a clear hierarchy of offensive coordinators operating at the highest level of efficiency. The findings reveal a blend of veteran play-callers and emerging talent — with several coordinators outperforming expectations based on tenure or program profile.

To maintain the integrity of our research and provide full access to our proprietary data, the final rankings — including composite scores and coordinator-by-coordinator analysis — are available exclusively to X&O Labs members.

Please log in now or join X&O Labs to view the complete findings and in-depth performance profiles.



Read More

Richmond University (VA) QB Draw Package from 10 Personnel Groupings

By Mike Kuchar with Kegan Kennedy
Offensive Coordinator/Offensive Line Coach
Davidson University (NC)
@CoachKKennedy


“Our quarterbacks weren’t burners; but were smart kids who can read the number three receiver. In 3×1 it was a clean and easy read for him.”
– Keegan Kennedy (former) offensive line coach, University of Richmond


If you watched the Richmond Spiders compete for (and win) a Colonial Athletic Association Championship last season, chances are you seen plenty of QB run game. But the difference between the Spiders QBR and others was that there was rarely any forced post-snap reads built in for the QB. Richmond muscled its way to a CAA championship by building off its QB draw concept from 10 personnel open formations. It became away to utilize two-back runs from one-back formations.

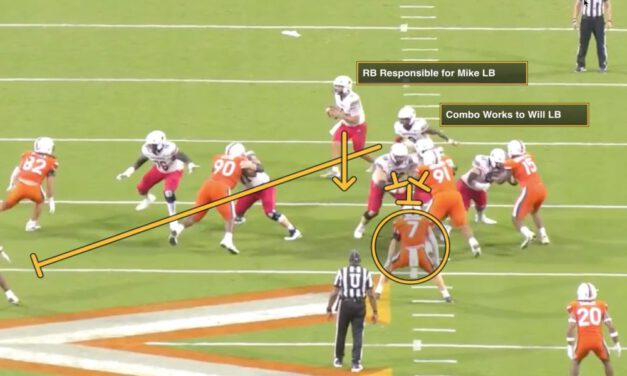
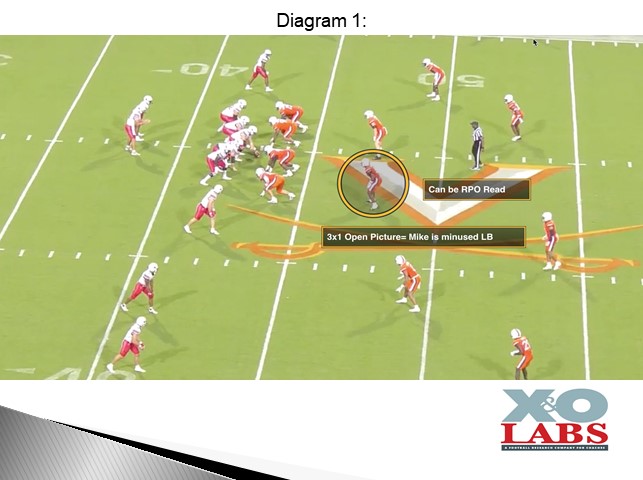
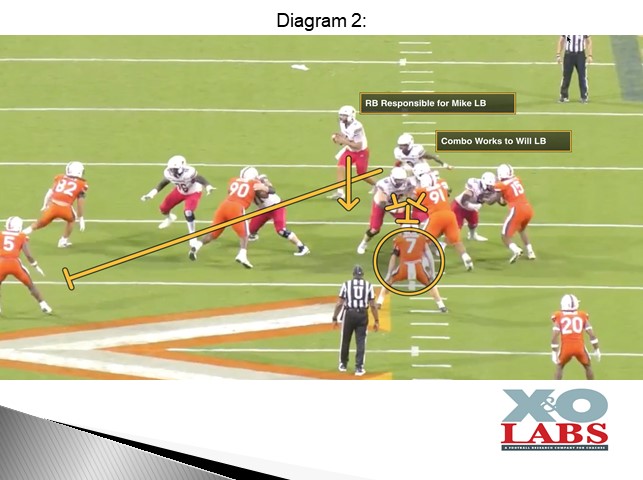
The concept was as simple as it gets and with a possible RPO attachment built in, it gave the quarterback the relief he needed if he didn’t like the picture. Day one install formations the concept in 3×1 open sets. This typically puts the Mike linebacker in a minused alignment in the box, giving the quarterback the six vs. five numbers he needs to run the draw.


The post snap contours for the number three receiver can be a true stick or hitch to the field where the quarterback- if asked- can read the Mike vs. two-high defense. The quarterback will execute a two-step drop at the snap and then execute his read. If the Mike relates to number three in anyway post-snap, the QB runs the draw. The beauty of the concept is that even if the quarterback chooses not to read the Mike, he is accounted for in the blocking scheme by the running back. The blocking scheme is as simple as it can get. The field side blocks the play side down defenders while the boundary side works its combo to the Will LB into the boundary.


Editor’s Note: While these QB draw concepts can be packaged with RPO elements, this report will focus solely on the run element of the scheme.


Read More

2025 Screen Game Research and Development – Case 3: Shoot Screens: The Newest Additive in the Wide Zone Family Cupboard

By Mike Kuchar
Senior Researcher/Co-Founder
X&O Labs
@MikeKKuchar


If you’re an offense that majors in the wide zone, then you’re going to need some complementary controls to keep those defensive ends from running the play down. Here’s the point/counterpoint on the traditional options:

  • Slice Concept– Y/H comes across the line of scrimmage to seal the C-gap defender. Problem– your Y/H may not be as big as their DE.
  • Boot Concept- Digs, Drags, and Posts are packaged with wide zone. Problem– your QB may not have the intermediate route acumen to handle completions.
  • Quick Game Controls- This is where quick route concepts like snags and spots are built into the backside of wide zone. Problem– not easy to teach and very expensive to install.


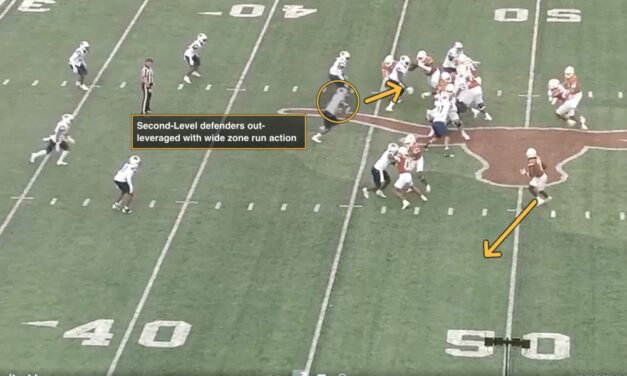
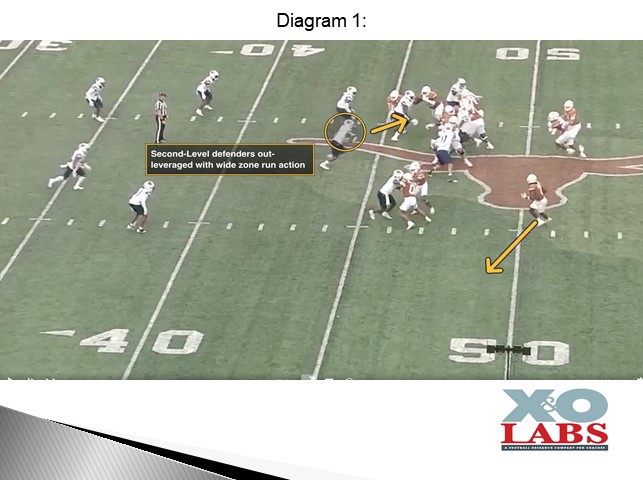
The latest build-in might just be the easiest to install, particularly if you have a speedy slot on the perimeter that can make plays. They are known as “shoot” or “line” screens and are packaged off wide zone runs. Similar to Slide RPO concepts, they are used from both compressed and open formations. And the benefit of the wide zone run action is that the full flow of the run scheme forces second-level defenders to become out-leveraged by the perimeter throw.


Prerequisite: What Your QB Must Have:

  • The arm strength to throw to the opposite hash (if needed)
  • The ability to build in run/run reads off the C-gap defender if cover down defenders are impeding the screen


Like the Slide, it’s a first-level RPO read based on numbers and grass. But most of the time, the decision of the quarterback is made pre-snap based on perimeter numbers. You don’t need to count the Mike linebacker because he will flow with the wide zone run action. So, against two-high looks, it’s a no-brainer to run the wide zone play because you have numbers.


Editor’s Note: In this report, Mike reveals the details of how this works, and best practices, and he identifies who else is using it. And, as always, Mike includes a lot of video and diagrams—as well as shares where to find more game film in X&O Labs’ Film Room. Login below to get unlock the full report (and if you’re not a member, click the ‘Join’ button in the upper right-hand corner of this page).


Read More

2025 Gap Scheme Research and Development – Case 5: Utah State’s “Open G” Concept

“One back power in our offense became a wasted play because our tight ends were 240-pound receiver types that couldn’t dig out a 260-pound 6-technique it was a wasted play. The G scheme was our answer.”
– Cooper Bassett, co-offensive coordinator, offensive line coach, Utah State University


By Mike Kuchar
Senior Researcher/Co-Founder
X&O Labs
@MikeKKuchar


Cooper Bassett found himself in the same conundrum as many offensive line coaches when working through the outside zone. There were just too many nuances of the scheme to make the play efficient. So, because he and the staff at Utah State wanted to make sure they built outside runs into their menu, the only other option was the Pin/Pull play. The problem was that they had no outside complement to that scheme.

So, he and graduate assistant Cob Summers started studying some University of Memphis tape from seasons before, where they both admired how Tigers offensive coordinator Kevin Johns was marrying some Pin/Pull elements from 11 personnel open formations. “Cob had been in the option offense before,” Coach Bassett told me. “And he was able to infuse some of those belly option principles into our Pin/Pull runs.”

Thus, the “Open G” scheme was formed.


Why it Works:

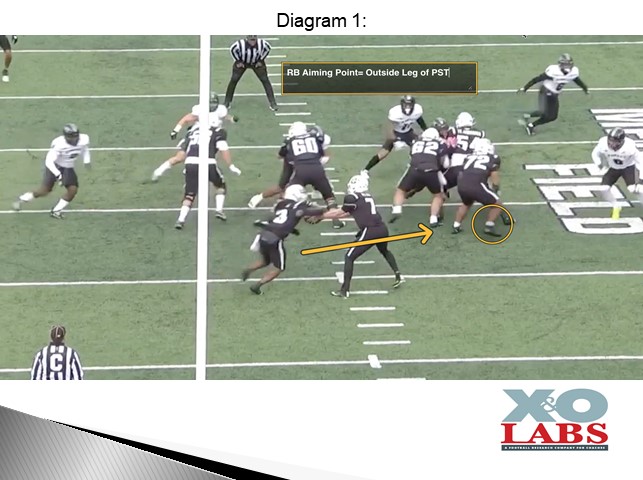
According to Coach Bassett, the lynchpin that makes the concept run is the mid-zone path of the back. Because he’s taught to press the play side leg of the Tackle, it looks identical to the two-surface mid zone play.


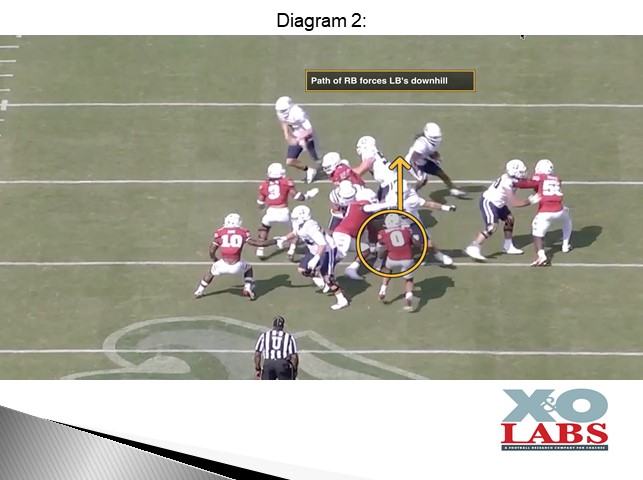
Allowing him not to be flat forces linebackers to get downhill quickly, setting up the front side kickout block of the Guard, where the entry point occurs. “We want the defense to see the shoulders turned of the running back, setting up flow to the sideline and creating a seam to hit underneath,” said Coach Bassett.


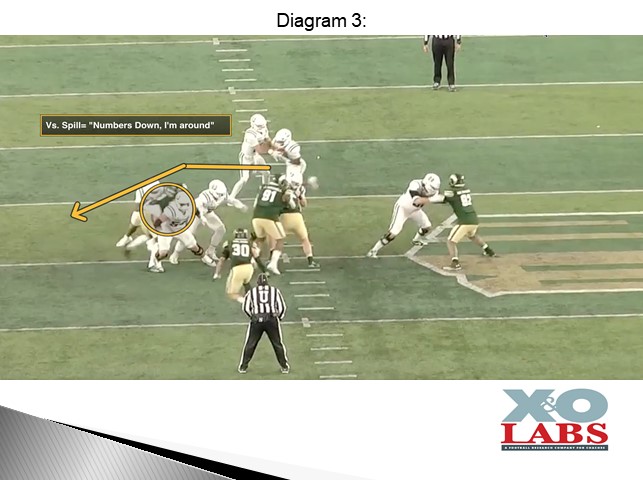
The back will press the kickout and get vertical as opposed to getting the edge and getting strung out with a pin/pull scheme. Coach Bassett classifies this into two important coaching terms based on the reaction of the C-gap defender.

  • Numbers Down- get around
  • Numbers To- run through


The “Open G” scheme can be paired with pure Pin and Pull when a detached tight end is added, which is explained later in the report. Ideally, the Open G can be checked to a play side 3-Technique where the Pin/Pull can be checked to a shade Nose.


Editor’s Note: In this report, Mike reveals the details of how this works, and best practices, and he identifies who else is using it. And, as always, Mike includes a lot of video and diagrams—as well as shares where to find more game film in X&O Labs’ Film Room. Login below to get unlock the full report (and if you’re not a member, click the ‘Join’ button in the upper right-hand corner of this page).


Read More