






By Mike Kuchar
Co-Founder
X&O Labs
@MikeKKuchar
The best way to stay out of third and long is to generate efficiency on the first two downs before it. That means staying ahead of the chains and putting your offense on track to move down the field. Of course, that’s easier said than done.
We wanted to help coaches by producing the formula needed to keep drives alive and end in kicks (scores). So, we analyzed the top ten efficient offenses in the country this season to study what they did on first and second downs to progress drives. And what we found is that there are four key areas needed to produce efficiency on early downs. We were able to track this using a tool that can easily measure your offensive efficiency as well. But more on that later. Let’s get to the findings of the study. Let’s start with the clarification of efficiency.
Definition of Efficiency:
- First Down: Four yards or more on 1st and 10 (or 40% of needed yards on 1st down)
- Second Down: Half the distance needed to convert on 3rd Down
- Third Down: First down conversion
- Fourth Down: Not measured
The Findings:
We analyzed the top 10 most efficient offenses at both the FBS and FCS levels this season. We found that these offenses were generating 9.3 yards per play, a 73.3% success rate, and a 28.3% explosive-play rate across 3,398 plays from 10 schools (Indiana, NDSU, Ole Miss, Georgia Tech, Ohio State, North Texas, Harvard, USC, Vanderbilt and Alabama State). This represents a highly efficient offensive sample.
What we present below is exactly what these offenses do on 1st and 2nd downs to stay out of third down and long situations. We’re going to provide you with the four key metrics that separate these offenses from every other outfit in the nation. Then we are going to show you how you can analyze your own offense using these metrics and put your plan in place this off-season to improve.
Finally, we are going to provide you with an actionable step you can implement this off-season to increase your efficiency on 1st and 2nd downs.
Metric 1: Offensive Run/Pass Balance
Sure, sounds obvious. But have you had a chance to look at exactly how balanced you were in both the run and pass game on early downs? This was one of those metrics we found to be strikingly similar based on the programs we studied. In fact, there wasn’t one program that generated a more than 7 percent differential between run and pass on first and second downs.
For example, North Texas was at a 51% run ratio on early downs, showing almost identical balance.
Indiana was not too far off at a 54% run ratio, Georgia Tech was at a 52% run ratio and Alabama State was at a 54% run ratio.
And when these offenses altered from their base personnel groupings, the run/pass balance dipped slightly but was still within 10 percentage points of each other.
Actionable Item: Run/Pass Balance in Your Base Personnel Groupings
The following offenses, like most, operate out of an 11-personnel grouping. But how balanced is your offense when you use other personnel groupings than your base? If you are a base 11 personnel outfit, how is your run/pass balance in 12 personnel? 13 personnel? Preventing defenses from getting a beat on your tendencies when switching personnel groupings is a major factor in early down efficiency.
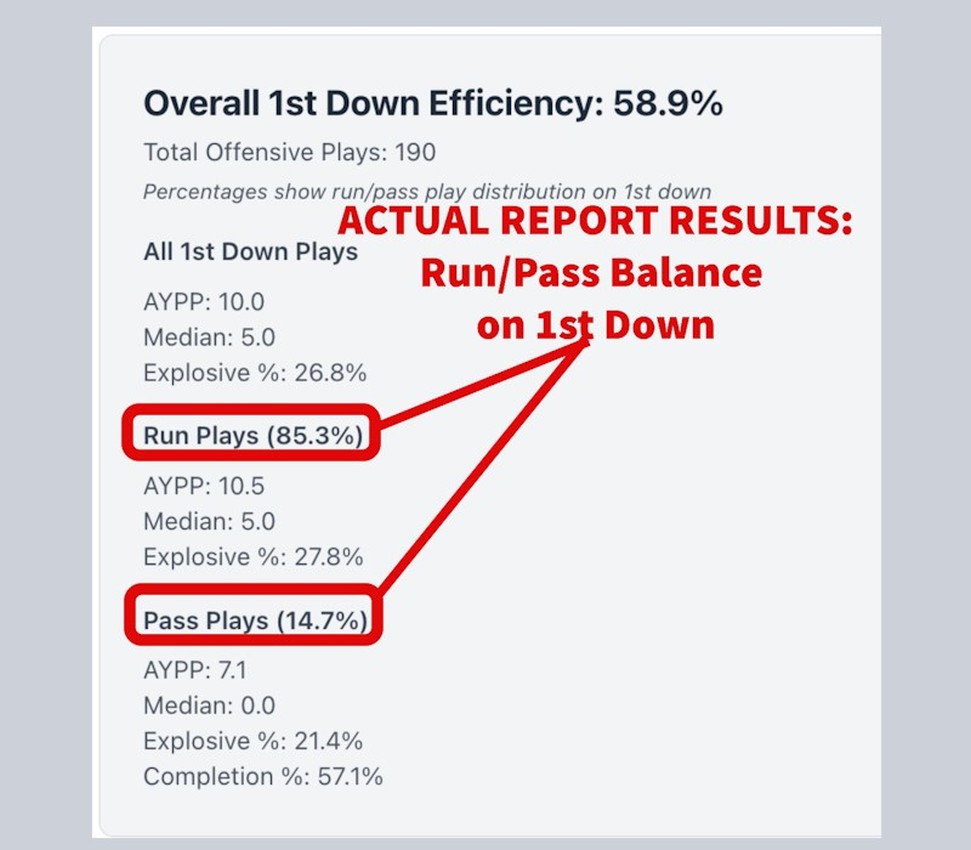
Self-Scouting Your Run/Pass Balance on 1st & 2nd Downs
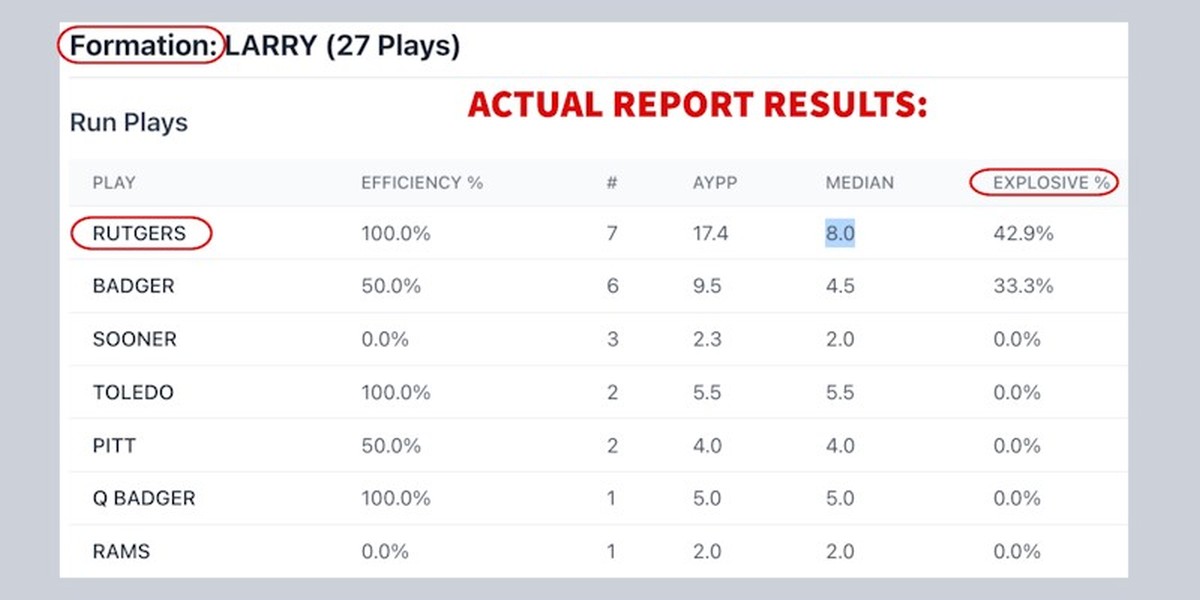
Your self-scout should include run/pass balance for both 1st down and 2nd down plays. In addition, you also want to know your average yards per play and the median yards for each play in both these downs. Do not rely solely on average yards per play. When you look at both average and median data, you’ll see the true quality of the play. We have just launched a simple, but powerful 1st Down Efficiency Report Generator and a 2nd Down Efficiency Report Generator for X&O Labs members. Just upload your offense’s data from Hudl and it instantly produces your detailed efficiency report that shows the true efficiency of every play you called on 1st and 2nd down by formation.
Metric 2: Generating Explosives on Field Position Patterns
Most explosive plays (10+ runs and 15+ passes) indeed occur on early downs. Why wouldn’t they? It’s when most defenses are committing more numbers to the line of scrimmage to stop the run. But we wanted to take a look at what part of the field do most of these explosives occur in. What we found is a pretty unique balance between the following zones:
- Coming Out (Goal line to minus 20)
- Deep in Own Territory (minus 20 to minus 40)
- Midfield (minus 40 to plus 40)
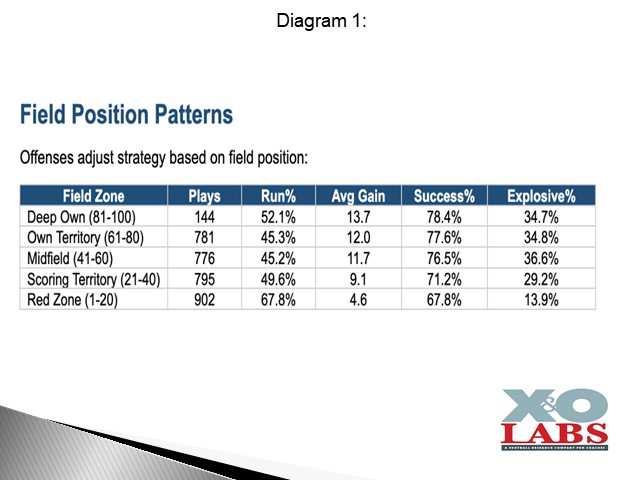
Most offensive coordinators wouldn’t think that explosives are generating so deep into an offense’s territory, but we found it to be true. Ole Miss generated an explosive rate of 39% on all first and second downs when they were in the minus 20 to minus 40 field position range. North Dakota State generated a 34% explosive play rate in the same territory. And Georgia Tech produced its highest yards per play (21.4 ypp) in the same area.
Actionable Item: Be Aggressive in Your Own Territory
I remember talking to coaches several years ago about the coming out zone and most of them told me the goal is to produce two first downs. Well, that mindset has completely flipped. Now, it’s about how many explosives can you generate in these areas. So, it’s important that you know what plays on your call-sheet are most explosive—then you call them in this area of the field. We are going to get into exactly how in the next metric.
Self-Scouting Your Overall Explosive Rate on 1st & 2nd Downs
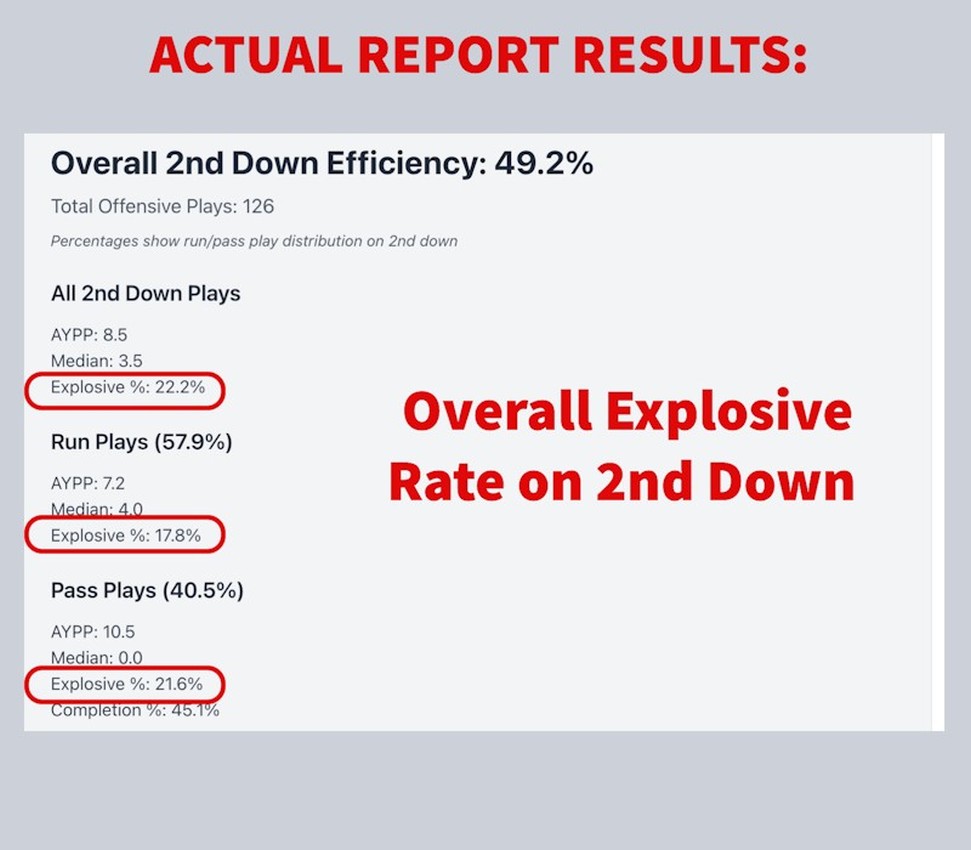
As our research discovered, the trend is now shifting to be explosive on early downs. But the issue we found was many high school and small college offensive play-callers don’t know their explosive play rate on 1st & 2nd downs. Our 1st Down Efficiency Report Generator and our 2nd Down Efficiency Report Generator, calculates your overall explosive rate by run and pass on both 1st and 2nd downs. Click the report links above and upload your offense’s data from Hudl and these report generators will instantly produce your self-scout reports.
Metric 3: Explosive Run Play Rate
Explosive runs are those that generate at least ten yards or more. So, you want to be able to produce these big plays on early downs to keep the defenses off-balance. Below is a general graphic of which runs generated the most explosive plays across the board with all these teams. We looked at a total of 1,786 runs on first and second down:
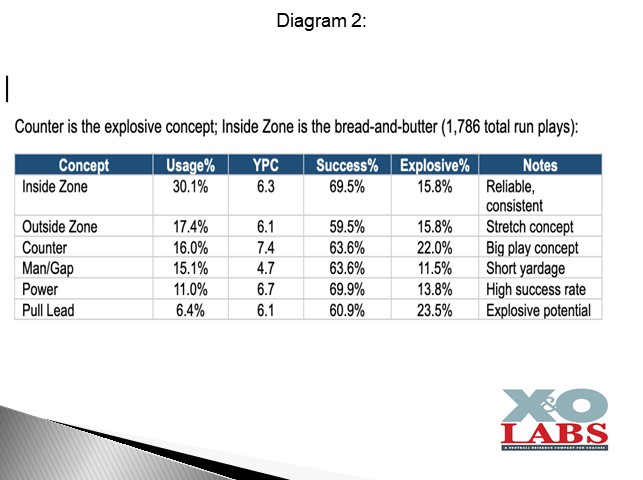
But here is the big takeaway: the most explosive runs were change-up runs and a major component of these offenses’ run menu. Save for Georgia Tech, whose entire offense is built on gap schemes, every other offense produced more explosives on change-up runs. For example, Ohio State’s most used run concept was tight zone, but it generated more explosives on wide zone.
North Texas majored in tight zone as well, but Pin and Pull runs produced a 29% explosivity rate. The same with North Dakota State, who, based on outside zone, produced a 36% explosivity rate on Pin and Pull. And Alabama State’s bread and butter was tight zone as well, yet counter produced a 31% explosivity rate.
Actionable Item: Script Your “Off-Color” Runs Early
The traditional mindset was to build in the off-color runs: your counters, misdirections, and traps on third down using the element of surprise. Instead, we found it important to work to break tendencies by scripting those off-color runs on 1st and 2nd downs. Alabama State produced a 22% explosive run rate on 1st and 2nd downs, and offensive coordinator Chris Barnette talked about making everything look like your base runs. He builds from the framework on players first, formations second, and plays third. From there he found that when he dresses different runs from the same presentations, explosives hit. “We are a tight zone run team at our core,” he told me. “But our explosives came when we would package the same look, formations and motions, and run a different scheme.”
Self-Scouting Your Explosive Rate for Every Play Ran on 1st & 2nd Downs
Do you know the explosive rate of every play you ran on 1st & 2nd down this past season? If you don’t, use our 1st Down Efficiency Report Generator and the 2nd Down Efficiency Report Generator to see the explosive rate of every play, both runs and passes, you ran on early downs by formation.
Metric 4: The Impact of Motion
Of the over 1,700 first and second down plays that we analyzed, 48.8% of used a motion or shift. So, that tells you the importance of building in motion on early downs to generate efficiency. In fact, North Dakota was the only offense that was more efficient without motion. The offense that built in motion on early downs displayed a significant advantage:
Ole Miss:
48% of plays use motion or shifts. When they use motion on 1st down:
- +2.9 yards per play improvement
- +10% higher success rate
- +7% higher explosive rate
Ohio State:
61% of plays use motion or shifts. When they do:
- +2.1 yards per play improvement
- +7% higher explosive rate
- Motion is critical on 2nd down (+3.5 ypp, +12% explosive)
Georgia Tech:
68% of plays use motion or shifts — this is a motion-heavy offense. When they do:
- +1.7 yards per play improvement
- +3.5% higher success rate
- +2.1% higher explosive rate
Alabama State:
43% of plays use motion or shifts. When they do:
- +1.5 yards per play improvement
- +6% higher success rate
- +7% higher explosive rate
Actionable Item: Build Your Play Off the Play
More motion equals more explosives on early downs. And for Alabama State, this process starts during the game week. Like most coordinators, Coach Barnette will study a motion clip to see how defenses are adjusting. For example, how does the defense adjust to 2×2 to 3×1 formations? “We look to see what they are doing and then build the plan off what they are doing, as opposed to running just plays with a motion,” he said. “We look at that a lot during the game week because we can build tendencies if we are in this formation, and we use this motion most of the time.”
But how does this translate into in-game efficiency? Coach Barnette calls it “a play off the play,” where he will script a play and then right next to it on his script sheet, he’ll have what he calls his “next play,” whether it’s a different run with the same motion or the play-action pass, screen, or RPO off it. “It’s all based on what they do to the motion,” he said. “Everything has to have a play off a play, and it has to look the same to the defense. It’s all based on the standpoint of the original play with the motion. If we do this and they do that, then what is my adjustment? You have to build the plays where you have the play, the play off the motion, a run, an RPO.
Self-Scouting Your Overall 3rd Down Conversion by Distance
If you follow the metrics listed above, you should find yourself in more favorable 3rd down situations. And then your focus should turn to increasing your conversions on 3rd down. In our brand-new 3rd Down Conversion Report Generator, you’ll instantly see your true conversion rate for 3rd and short, medium, long and extra-long. Plus, you’ll also get a breakdown of every 3rd down play you’ve ever ran by distance, formation and conversion percentage. And like all of our report generators, you also get explosive rate, yards per play and median yards. In the video below, Waverly High School offensive coordinator, Jacob Knight, explains how to get the most out of this new 3rd down self-scout tool. Remember, all our scouting analytics tools are included with your X&O Labs membership.